Everybody Lies: What The Internet Can Tell Us About Who We Really Are (Book Summary)
Seth Stephens-Davidowitz, an ex-Google data scientist and op-ed writer for the New York Times and The Guardian, gives insight into how we can use data collected by websites and search engines in this fascinating dive into big data and analytics.
In this book that’s been called “Freakonomics on steroids,” the author tells us why everybody lies, exploring topics ranging from elections to sex. He also sheds light on the fact that we actually share more private information with search engines than with our colleagues.
Stephens-Davidowitz explores big data trends that show that we often lie, or at least avoid telling the full story, in our day-to-day lives (especially when no one is looking). In a useful read full of memorable take-homes, he draws insights from big data relating to various spheres of our lives.
PART I:
Stephens-Davidowitz analyzes patterns and trends to help show people’s preferences and habits when using search engines. He starts by introducing us to big data, and to the big ideas it can support.
What is “Big Data?”
“Big data” refers to large amounts of data that can only be understood using computational power.
Many people use the intuitive concepts of data science daily without even realizing it. However, intuition is not the same as data science. Our predictions and gut feelings can only be proven or disproven when we use historical data correctly.
Big Data Doesn’t Lie
People enter their queries into search engines with no one watching. This means the information we get from big data doesn’t lie, unlike information from other surveys and studies.
The author notes that data science isn't just about how much data is gathered or obtained, but also about how appropriately it gets used. Not all data can help make predictions or reveal trends.
How can we use big data appropriately? We could calculate the prevailing rate of unemployment using Google queries instead of Bureau of Labor Statistics reports, for example. Google data trends might also shed insight on the rate of infectious diseases, as opposed to data from the Center for Disease Control.
Stephens-Davidowitz writes about Jeremy Ginsberg, who tracked disease statistics using big data. Ginsberg monitored Google searches to find locations where outbreaks were happening. This helped him discover where influenza was breaking out across geographical regions over time.
Racism is Very Much Alive – in the US
The introduction to Everybody Lies is far from elementary. Early in the book, Stephens-Davidowitz makes the firm, bold assertion that racism is very much alive in America. Using search data from Google Trends, Seth demonstrates that racism became extremely prevalent in the aftermath of the 2008 presidential election and grew even more during the 2016 election.
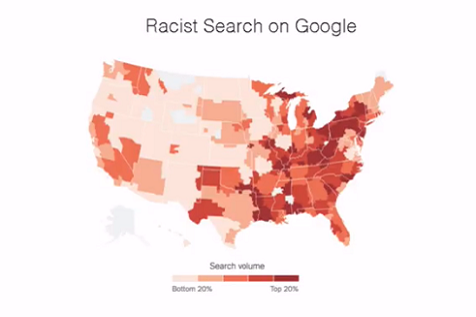
The author uses an eerie geographical comparison, which he calls the “racial heatmap,” to show how people in the areas that largely supported Trump also made the most searches for the word "nigger".
He also observes that most traditional sources commented on a "post-racial" America after Obama's election, but adds that these commentators could not be farther from the truth. Stephens-Davidowitz claims his knowledge of this racist America stems from trends he observed in Google’s search data. He writes, “There was a darkness and hatred that was hidden from traditional sources.
Those searches are hard to reconcile with a society in which racism is a small factor." The data shows how the polarized electorate became primed to respond to Trump's ethno-nationalist rhetoric.
Other early signs of this racially polarized nation are found in the Google searches that streamed in on Obama's election night. Stephens-Davidowitz found that one in a hundred searches on Google that day that included the word “Obama” also included the "n-word" or "KKK". He also noticed a surge in searches for racist websites like Stormfront.
Marketing Can Change the World:
Big data isn’t just useful for understanding the political sphere. The author also offers some critical advice for marketers: big doesn’t always mean best; it’s what you do with it that matters. (He offers the same advice in chapter four to men worrying about their penis size.)
Stephens-Davidowitz writes that marketers need to ask the best questions to get the most out of big data. Those questions may not match those asked in traditional surveys.
He uses the case of Kodak, who made people smile in photos, to show how marketing can change the world. Kodak wanted people to take regular photos, not one-off portraits, so the brand linked photos to happy moments in its advertising.
To master big data, the author believes that data science takes an intuitive and natural human process – spotting patterns and making sense of them – and injects it with steroids. This can show us that the world doesn’t work the way we think it does.
Business Success Through Understanding Human Nature
The author adds that understanding human nature can help lead businesses to success.
He argues that Facebook was built on an understanding of human nature. Facebook’s users complained that the “news feed” concept was creepy at first.
However, Facebook's founder Mark Zuckerberg knew further growth was inevitable, thanks to our natural human curiosity about what others are doing.
Big Data Enabled A/B Testing
A/B testing helped make online platforms addictive by allowing people to perform randomized controlled experiments in a small time frame.
Correlations, like a specific food linked to a disease, appear credible at first, but don’t necessarily imply a cause and effect relationship. Running A/B tests can help establish causality.
A study may show that people who drink alcohol moderately are moderately healthy, but that doesn’t mean drinking alcohol actually makes one healthy - or does it?
To disprove such a hypothesis, one would need two randomized groups of individuals. One group would drink a glass of red wine daily, and the other group would drink none. Their health would get measured at the beginning of the test, and again after one year.
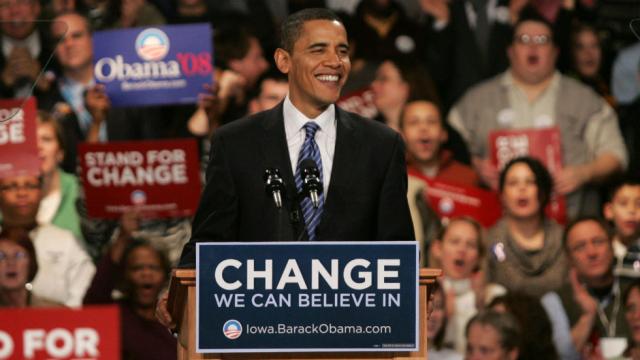
Big data enables one to conduct these types of A/B tests. Barack Obama’s 2008 presidential campaign used A/B testing to determine the kind of image and text layouts that would get people to sign up and donate on his website.
Social Desirability Bias
In addition to racial attitudes and marketing, Stephens-Davidovitz explores the disconnect between our private thoughts and our public words, and between our actual lives and our social media lives.
This theme of disconnect, or the "social desirability bias," brings the title of the book to life. The author warns marketers to remain skeptical of self-reported data obtained from surveys or gathered on Facebook - the ultimate arena where "everybody lies."
He uses the example of a graduating class at the University of Maryland who took a survey about their GPAs. Just 2.5% admitted that they had a GPA of less than 2.5, but official school records showed that 11% of students actually had GPAs of 2.5 or less.
The social desirability bias means that people tend to change their responses so they’ll seem more desirable to other people. Because of this, the author argues that surveys are unreliable for understanding people’s thoughts, desires, beliefs, and behavior.
PART II: THE POWERS OF BIG DATA
In this section, Stephens-Davidovitz discusses the possibilities of big data.
Big data offers new types of data, and honest data. No one lies in their Google search bars. In fact, many turn to Google in times of hardship, and tell the search engine what they might not tell anybody else – friends, family members, or even themselves!
Common confession-style searches on Google include “I am happy,” “I’m sad,” “I’m drunk,” or “I hate my boss.” Other searches are more unfortunate and depressing. After the terrorist attack in San Bernardino in 2015, in which 14 people died and another 22 were seriously injured, top searches on Google included “Muslim terrorists” and “kill Muslims.”
While the author appreciates that we lack the context to reliably guess what these people were trying to express, the data says something about their intentions.

President Obama’s mention of Muslim sports heroes provoked curiosity, redirected attention, and potentially provided new information. This shows that data has the power to change how people act and react.
Big data also allows us to zoom in on small subsets of data for analysis. As Stephens-Davidowitz writes, “We can compare, say, the number of people who dream of cucumbers versus those who dream of tomatoes.”
Harvard professor Raj Chetty used big data to find out the chances of people with poor parents getting rich in America. He found that in countries like Denmark and Canada, people had chances of 11.7% and 13.5%, respectively. In the United States, the chance was a dismal 7.5%.
An analysis of similar data shows that in San Jose, CA, the chance of a poor American getting rich is 12.9%, compared to only 4.4% in Charlotte, NC. On the flipside, we find another sad reality. While rags-to-riches narratives are widespread in American basketball, the data shows a different story: growing up in poverty lowers a kid’s chances of making the NBA.
Finally, big data allows us to conduct many causal experiments. These tests typically get used by businesses, but have the potential to expand to social science, since they go beyond testing for correlation.

In an anecdote on “Bodies as Data,” Stephens-Davidovitz writes about the conquests of the most recent Triple Crown winner, American Pharaoh. Everyone’s racecourse fantasy is to own a winning horse of the highest pedigree. Jeff Seder overturned this methodology at the Saratoga Springs horse auction in 2013 after carefully analyzing the horses’ physical stature in comparison with previous winning horses.
He discovered that the size of the horse’s left ventricle played a huge part in determining the horse’s success. American Pharaoh had a left ventricle in the 99.61 st percentile, so Seder convinced his past owner to buy him back. This became a million dollar buyback.
PART III: BIG DATA: HANDLE WITH CARE
In this final section of the book, Stephens-Davidovitz’s writing is terse, yet rich with information. He adds a caveat to his information about big data and its increasing popularity, mentioning the “curse of dimensionality” and the dangers of big data.
For example, an independent variable can seem statistically significant before it has been tested nearly enough times. In 1998, Robert Plomin thought he’d found gene IGF2r, which was linked to IQ levels. In a data-set of several hundred students, he observed that the gene occurred twice as often in people with high IQs as in those with lower IQs. Two years later, his observation could not be replicated. It had been a fluke correlation. Coincidental matches are nothing more than that – pure chance.
Stephens-Davidovitz claims that it’s dangerous for the government or corporations to have lots of data because it provides a means for coercion. The recent crisis at Facebook over its cagey relationship with data firm Cambridge Analytica shows why we need to be mindful of the data that corporations and governments wield. He suggests remaining watchful over the development of this new front of data science, and the information overload that can come with it.


